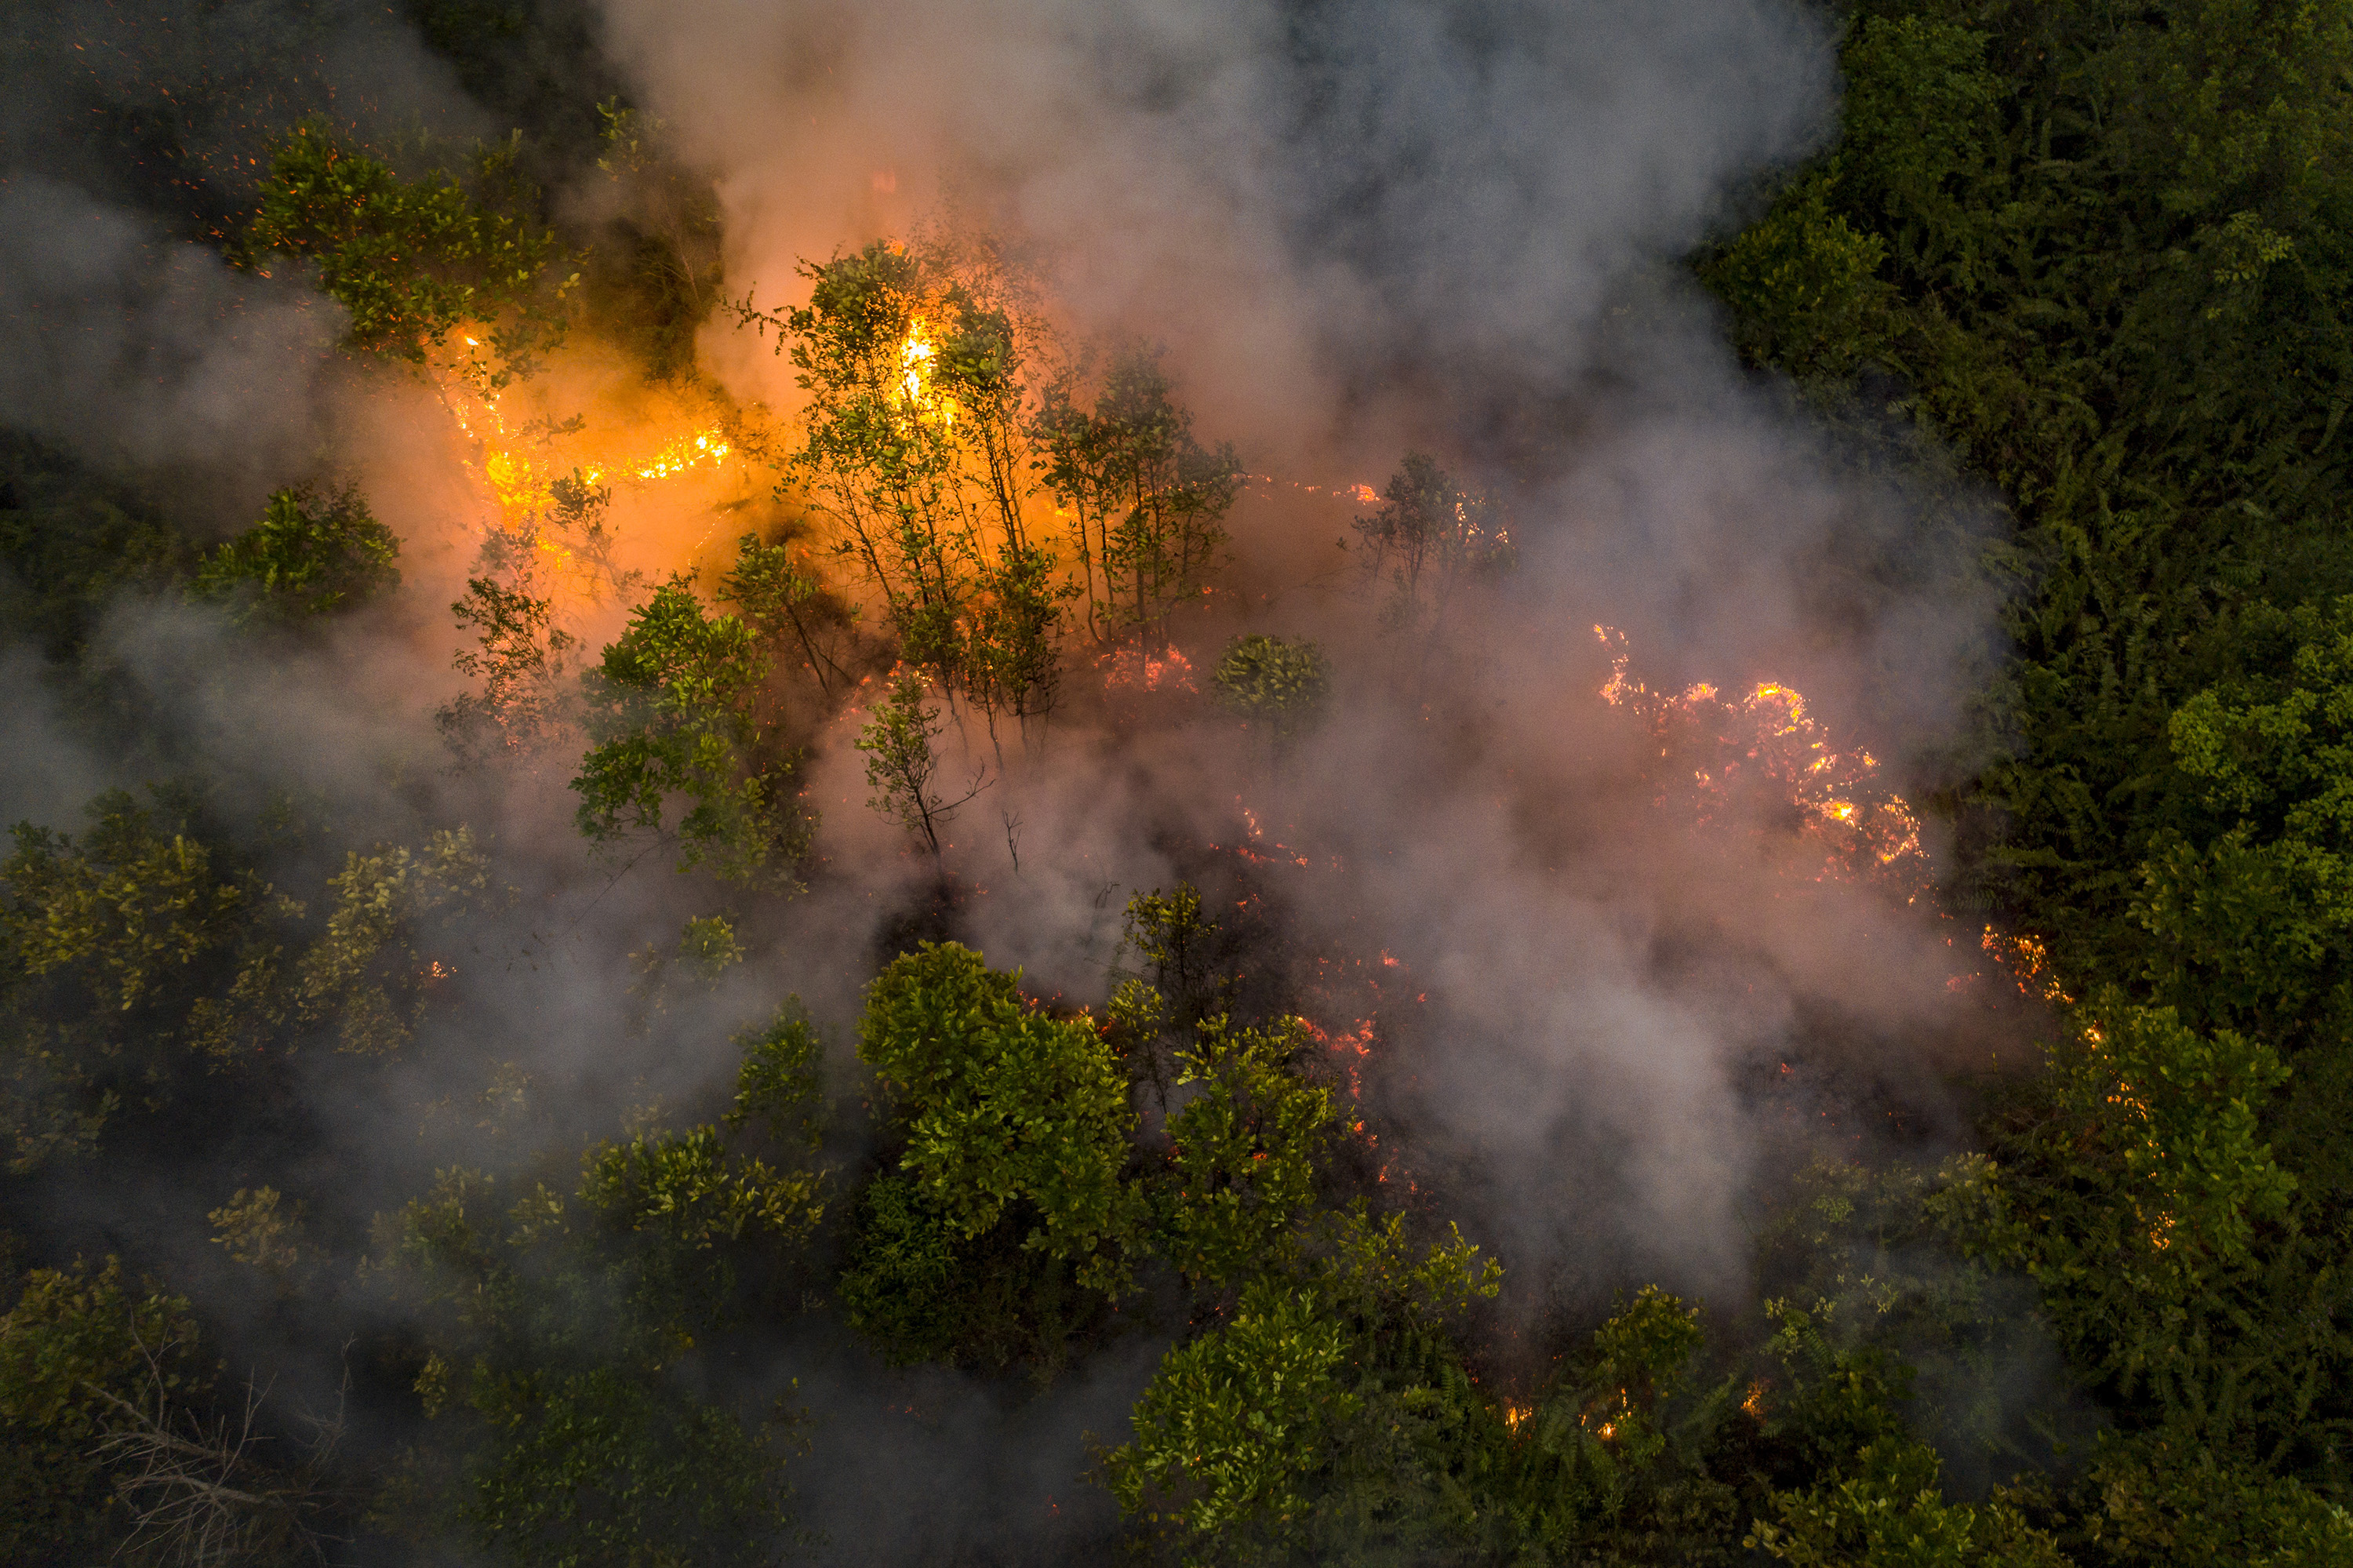
 Fire burns peatland and fields in Central Kalimantan, Indonesia on September 22, 2019. (Ulet Ifansasti for The New York Times)
 Decoding Fire Alerts in Nusantara Atlas
Fire burns peatland and fields in Central Kalimantan, Indonesia on September 22, 2019. (Ulet Ifansasti for The New York Times) As Indonesia’s fire season escalates into its acute phase, exacerbated by the El Niño phenomenon, and with September historically marked as the most critical month for vegetation fires in the country, this article endeavours to provide clarity on fire alerts within the Nusantara Atlas. Its purpose is to assist users in comprehending and optimizing the utilization of these data. Additionally, it offers an overview of the Indonesian palm oil and pulpwood concessions, and districts most severely impacted during this first week of September, while offering guidance on leveraging the Nusantara Atlas for fire detection purposes.
What do fire alerts in Nusantara Atlas mean?
Nusantara Atlas integrates fire alerts from NASA-FIRMS website. It combines fire data from two primary sources: MODIS (Moderate Resolution Imaging Spectroradiometer) and VIIRS (Visible Infrared Imaging Radiometer Suite). These sensors, equipped aboard various satellites, actively monitor and detect thermal anomalies and active fires on the Earth’s surface.
Both MODIS, present on the Terra and Aqua satellites, and VIIRS, aboard the Suomi NPP and NOAA-20 satellites, supply fire alert data approximately four times daily. This high frequency allows them to revisit the same Earth locations roughly four times within a 24-hour cycle.
These satellite-based systems are designed to identify high-temperature events, encompassing wildfires, agricultural burns, volcanic eruptions, and industrial fires. They employ sensors sensitive to both visible and infrared radiation. When a significant thermal anomaly is identified, it triggers a fire alert.
MODIS fire alerts typically possess a spatial resolution of 1 km, meaning that each fire alert represents a 1km x 1km area on the Earth’s surface. On the other hand, VIIRS fire alerts offer higher spatial resolution compared to MODIS, with a typical resolution of 375 meters. Consequently, each pixel in the VIIRS fire alert corresponds to a 375m x 375m area on the Earth’s surface. Being of higher The improved spatial resolution of VIIRS provides a greater response to fires over relatively small areas and has improved nighttime performance.
Nusantara Atlas integrates MODIS and VIIRS alerts into a single measurement (expressed in the number of fire alerts detected in a given area (for example an oil palm concession) so that the fire that might be missed by one system or the other can be detected through the strengths of both systems.
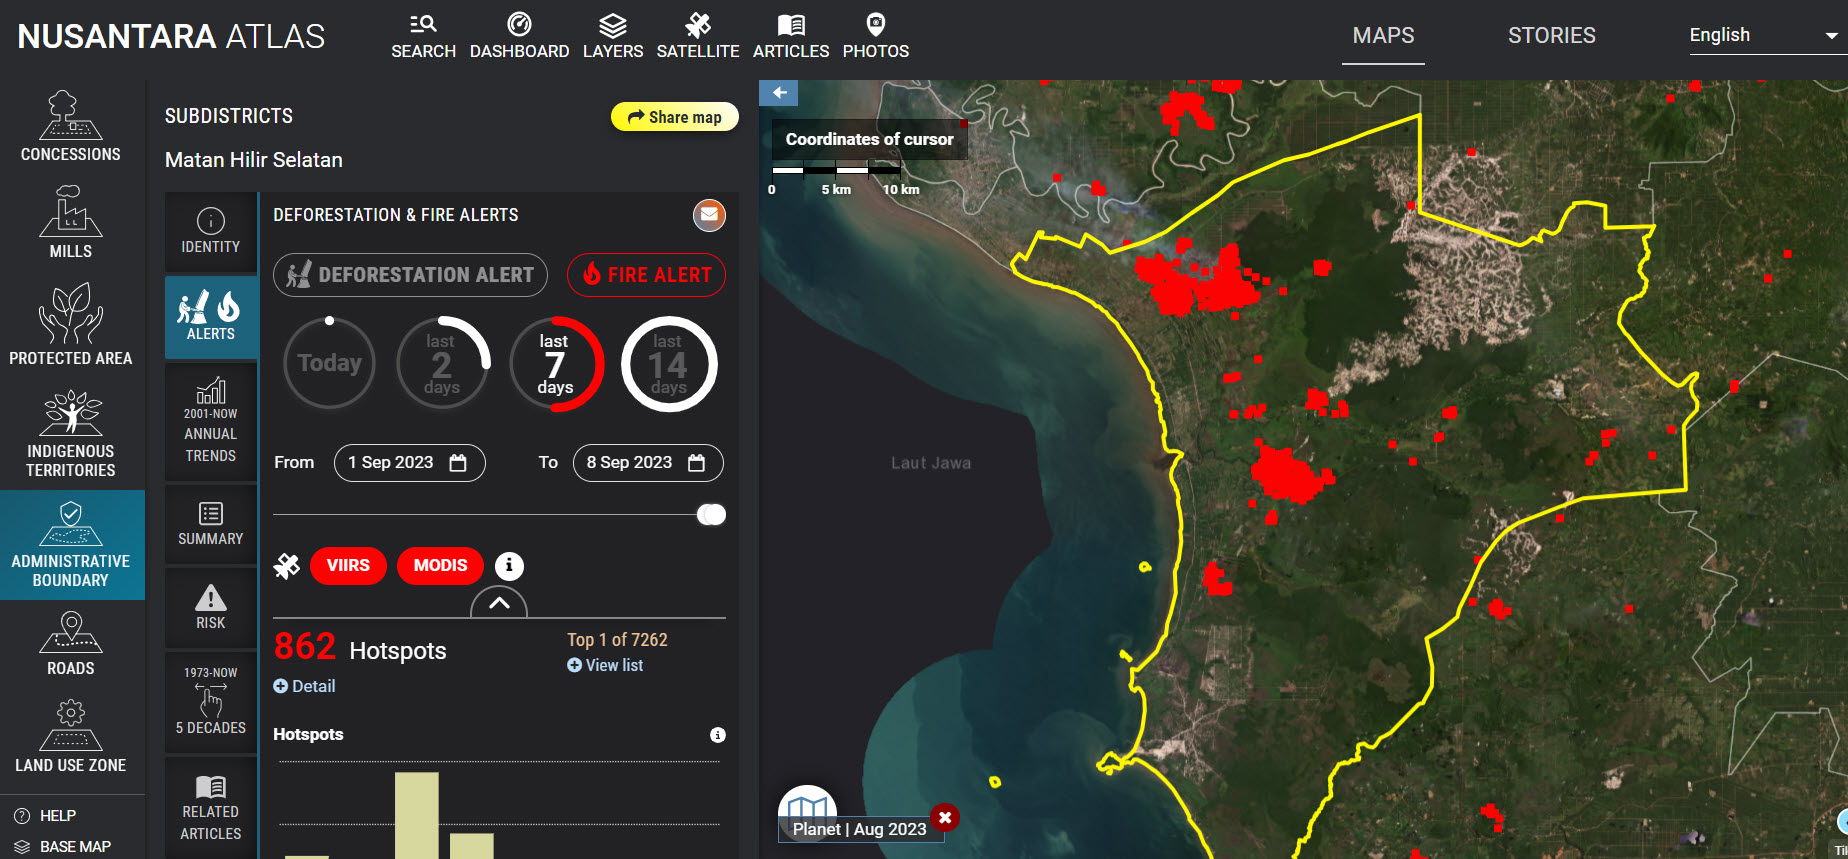
It provides default access to fire alerts for pre-defined timeframes, including Today, Last 2 days, Last 7 days, Last 14 days. Additionally, users have the option to customize their timeframe, allowing them to select any period starting from 360 days prior.
Fire Alert Dashboard
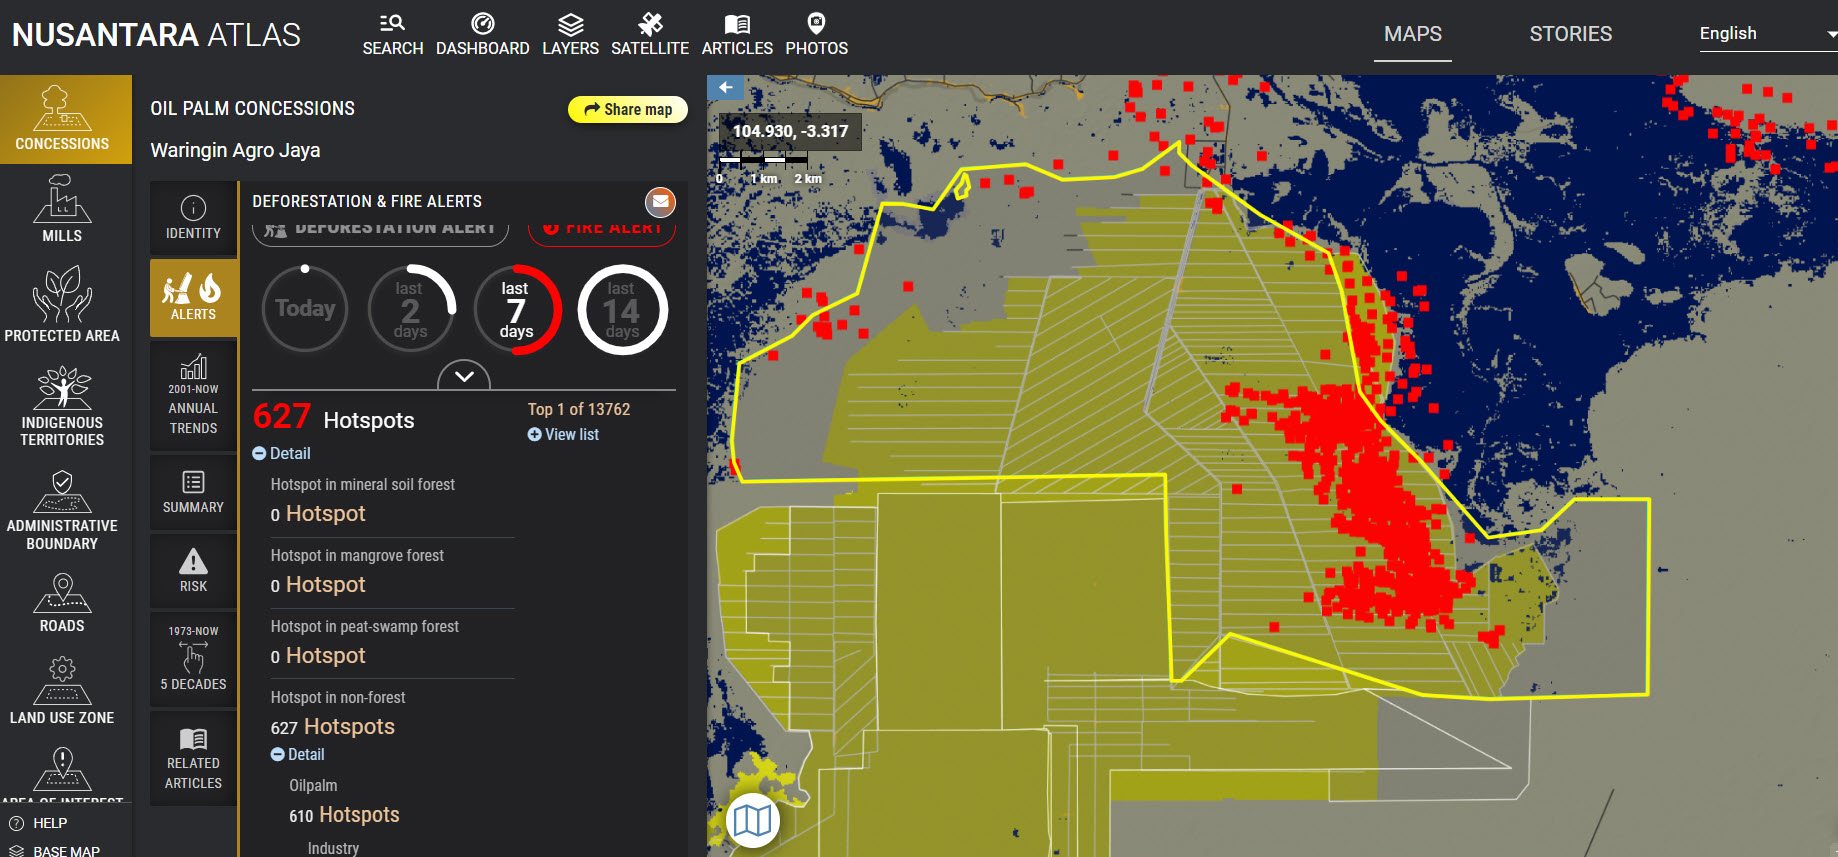
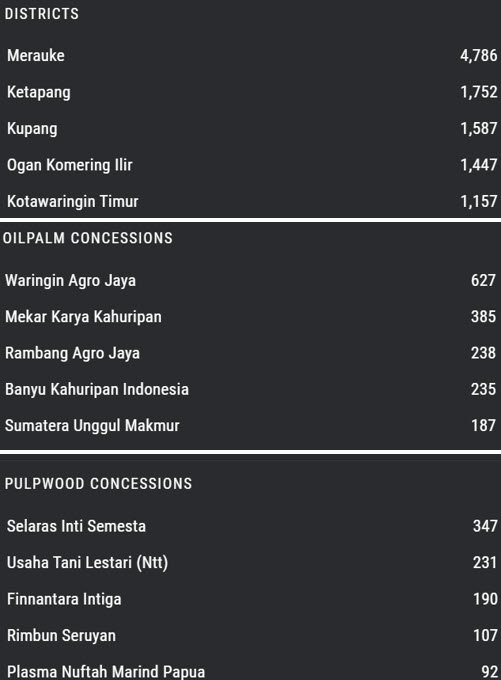
The system showcases a dynamically updated daily alert dashboard, effortlessly integrating fire alerts with critical land-use elements such as palm oil, pulpwood, mining concessions, palm oil mills, protected areas, and administrative boundaries, down to the village level. This tool aids in the strategic allocation of firefighting resources, spotlighting priority regions by highlighting prominent concessions, processing facilities, protected areas, and administrative boundaries currently experiencing fires that demand immediate attention. As an illustration, over the past seven days, from September 1st to 8th, 2023, the highest number of fire alerts was recorded in the oil palm concession Waringin Agro Jaya in South Sumatra (627 fire alerts).
How does Nusantara Atlas distinguish between forest fires and other situations?
Nusantara Atlas employs a land cover classification system based on previously published maps of plantations and primary forests to differentiate between forest fires and fires related to other land cover changes. In the case of plantation areas, Nusantara Atlas references regularly updated maps of oil palm and pulp-and-paper plantations. To identify forest fires, specifically within primary evergreen forests, Nusantara Atlas employs a classification system that includes three distinct classes: mangrove forests, peat-swamp forests, and other primary forests. The total count of fire alerts is quantified and reported as the default metric for each land cover type. For additional details, users can click on the “Detail” option provided below this metric. These details specify whether the detected alerts are associated with mangroves, peat-swamp forests, forests on mineral soils, plantations, or any other non-forest area.
Limitations of the fire alert data
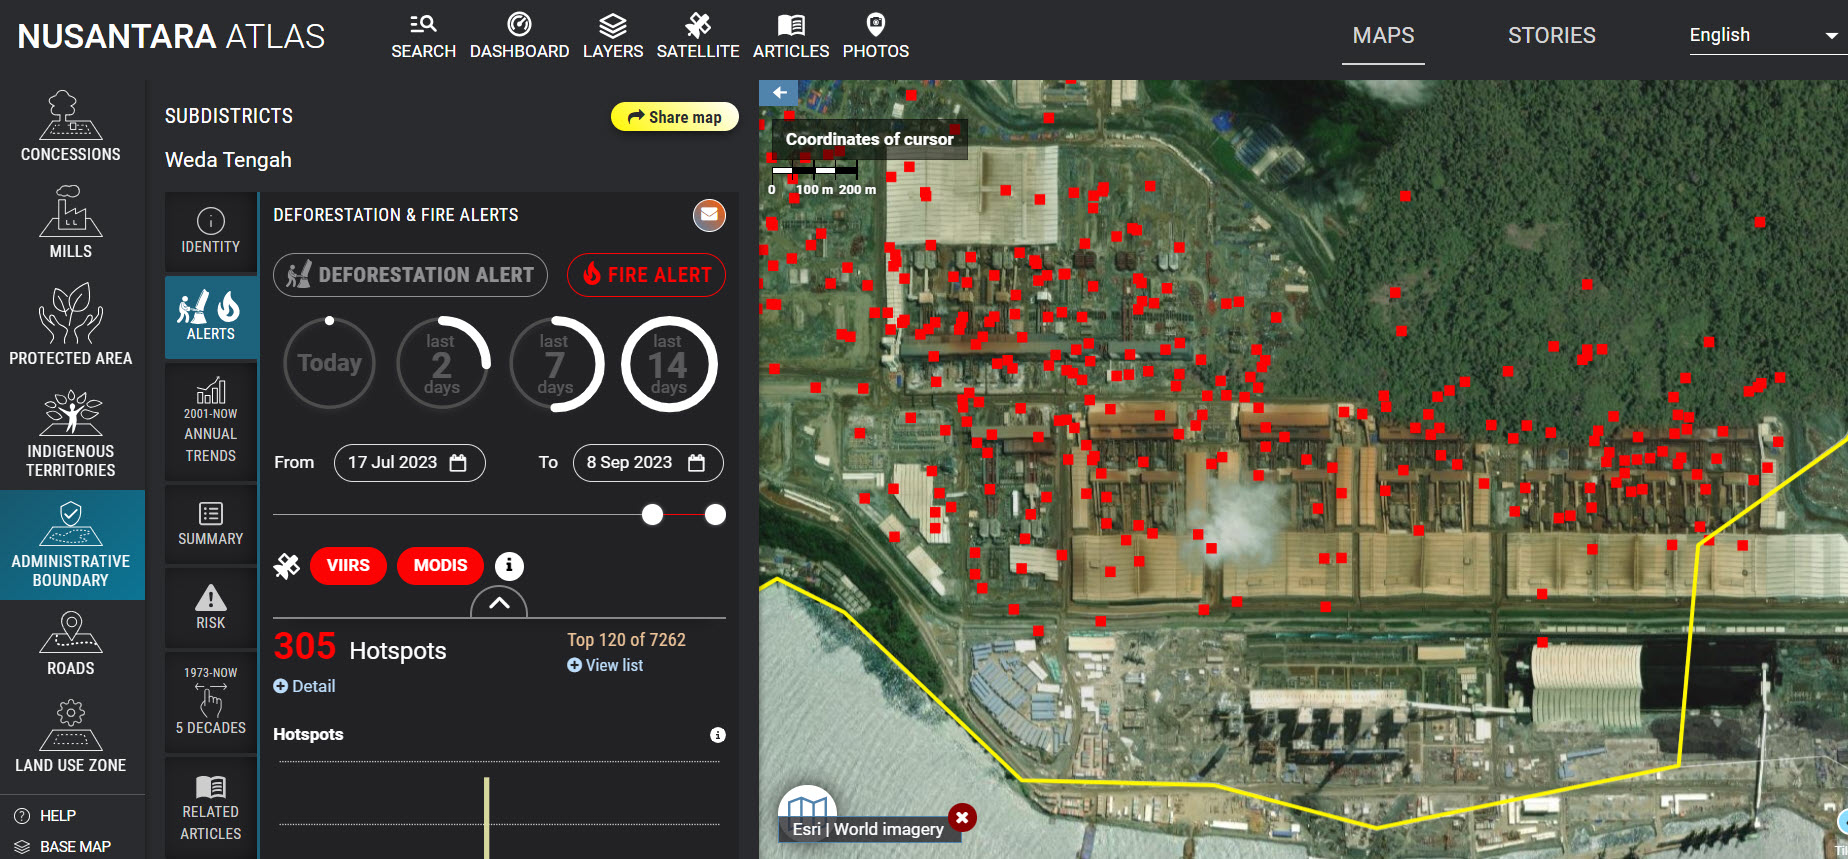
While integrating MODIS and VIIRS alerts improves fire detection accuracy, it’s important to note that it’s not infallible. False alerts may still occur. For instance, features like tin roofs and factories can exhibit fire hotspots, not due to an actual fire, but because of the high temperatures they emit. This is illustrated in the example below, where numerous fire alerts are observed over Weda Bay Industrial Park, a complex housing both nickel mining and industrial facilities in Central Halmahera Regency, North Maluku, Indonesia. These alerts aren’t indicative of actual fires, but rather signal the significant heat emissions from this industrial park.
Verifying alerts using high-resolution satellite imagery
We recommend utilizing the high-resolution satellite imagery provided by Nusantara Atlas to verify whether the fire alerts correspond to actual vegetation fires. The Sentinel-2 imagery, with a resolution of 10-20 meters in both infrared and visible colours is the most reliable option for confirming these alerts. This is because Sentinel-2 conducts frequent revisits to the same area every 3-5 days, surpassing the revisit frequency of Landsat, which occurs every 16 days, and Planet/NICFI, which revisits monthly.
You can verify fire alerts by comparing imagery acquired before and after a fire event or by creating a time-lapse animation that illustrates the progression of vegetation fires over the course of several days. Sentinel-2 images, particularly in the visible and infrared bands, can detect smoke plumes, burn scars, and the active flaming front. Typically, a vegetation fire is detected when an area shifts from a “green” to a darker “brown/red” tone, indicating charred remains in the infrared images. Additionally, bright orange hotspots may be visible, signifying active flames, in the same infrared images. Smoke plumes can also be observed in true color images, although they are less prominent in infrared images, as infrared light penetrates through smoke more effectively than visible light. In Nusantara atlas infrared images are labelled “false color” and visible light images are labelled “natural color”. The animation below shows the steps to compare before-after fire images, to generate satellite animations and the infrared and visible light images.
Is this year worse than last year ?
Examining the yearly trend of daily fire alerts in Indonesia, users have the flexibility to choose a timeframe, going back up to 360 days. Notably, the daily trend in fire alerts presents a distinct rise in fire alerts this September (2023) when compared to the same month last year (2022). This increase is anticipated due to the current El Niño event resulting in drier conditions. The animation below demonstrates the process. Start by selecting “Indonesia” in the search box, then proceed to choose the entire 360-day range (be patient it might take a while for the entire data to load).
Top 5 districts, palm oil and pulpwood concessions, most severely impacted during this first week of September 2023
By utilizing the alert dashboard presented above, we have compiled a list of the top five oil palm and pulpwood concessions, as well as the top five districts experiencing the highest incidence of fires during the initial week of September (from September 1st to 8th, 2023).
Conclusion
As Indonesia faces the peak of its fire season intensified by the El Niño phenomenon, this article has provided a comprehensive guide to interpreting fire alerts within the Nusantara Atlas. By leveraging the integrated data from MODIS and VIIRS, users can gain critical insights into fire occurrences across the country. The Atlas’s ability to distinguish between various land cover types ensures that forest fires are accurately identified and differentiated from other situations. While the data is highly valuable, it’s essential to acknowledge its limitations, including potential false alerts.
Furthermore, the article highlights the significance of high-resolution satellite imagery in verifying fire alerts. Sentinel-2 imagery emerges as the most reliable option due to its frequent revisits and superior spatial resolution. This tool allows users to observe and analyze fire-related phenomena in great detail.
Finally, the article compares fire alerts between this year and the previous year, showcasing a noticeable increase in alerts for September 2023, attributed to the prevailing El Niño conditions. This trend underscores the urgency of effective fire monitoring and mitigation efforts.
By utilizing the Nusantara Atlas and its associated tools, stakeholders can proactively address fire-related challenges and work towards a more sustainable and fire-resilient Indonesia.