 Deforestation alerts over Indonesia's worst-performing pulpwood concession in 2022
 Decoding Deforestation Alerts in Nusantara Atlas
Deforestation alerts over Indonesia's worst-performing pulpwood concession in 2022 This article aims to clarify deforestation alerts in Nusantara Atlas, helping users comprehend and maximize the use of this data.
Nusantara Atlas is on the front lines of the fight against deforestation in palm oil, pulp-and-paper, and mining supply chains in Equatorial Asia. By combining near real-time deforestation alerts, and comprehensive cadastral and supply chain information, it holds producers and buyers accountable to no deforestation, no fire, and no peat exploitation regulations like the Indonesian Moratorium, RSPO and FSC certifications, and the new EU Deforestation Regulation.
Deforestation alerts also assist the conservation efforts of governments and NGOs in protected areas. A recent case highlights the critical role of early detection in preserving the planet’s precious forests and biodiversity. In 2022, alerts detected a sudden surge in deforestation within a well-preserved wildlife sanctuary, home to a large population of orangutans. This knowledge mobilized NGOs to investigate and send boots on the ground. The situation is currently contained.
What do deforestation alerts in Nusantara Atlas mean?
The Nusantara Atlas alert system integrates two algorithms, namely GLAD and RADD, which detect deforestation i) weekly using optical Landsat imagery with a spatial scale of 30 meters or ii) bi-weekly using radar Sentinel-1 imagery at 10 meters.
Nusantara Atlas integrates GLAD and RADD alerts into a single measurement (expressed in hectares of forest cleared) so that the deforestation that might be missed by one system or the other can be detected through the strengths of both systems.
It provides default access to deforestation alerts for pre-defined timeframes, including the last 30, 60, 180, or 360 days. However, users also have the flexibility to select any timeframe starting from January 1st, 2022 onwards.
It features a dashboard that seamlessly links deforestation alerts with various key land-use components, including palm oil, pulpwood, mining concessions, palm oil mills, protected areas, and administrative boundaries, all the way down to the village level. This invaluable functionality empowers anyone to quickly pinpoint the companies involved in forest clearance, as well as palm oil mills, protected areas, districts, and municipalities affected by deforestation.
We recognize that deforestation alerts can be difficult to comprehend for some users. To address this issue, we offer clear and concise explanations in the following paragraphs to assist our users in comprehending and effectively utilizing the deforestation alert data.
What do GLAD and RADD alerts measure?
RADD alerts detect ‘tree loss’ only within a global primary humid tropical forest mask described here. In contrast, GLAD detects the removal of any collection of trees (tree height > 5m and canopy cover > 60%) whenever a Landsat pixel experiences a canopy loss in excess of 50% cover, which means that GLAD alerts do not distinguish between the clearing of forest trees and the clearing of old unproductive oil palm or the harvesting of acacia and eucalyptus trees for pulp-and-paper that also present tree height >5m and canopy cover > 60%.
How does Nusantara Atlas distinguish between deforestation and other situations?
To distinguish between deforestation from other land cover changes, Nusantara Atlas classifies deforestation alerts using previously published plantation and primary forest maps. To classify alerts in plantations, which indicate the clearing of old unproductive oil palm or the harvesting of pulp-and-paper plantations, Nusantara Atlas uses annual maps of oil palm and pulp-an-paper plantations published here, updated every year, and recently extended to Malaysia. To classify alerts in forests, which indicate deforestation, Nusantara Atlas combines four forest maps for Indonesia, Indonesian New Guinea, Malaysian Borneo and Brunei, and Peninsular Malaysia, all created using Landsat imagery and computer models trained on the spectral characteristics of primary evergreen forests, which present lower albedo and higher spectral variability than young forest regrowth and most surrounding agricultural lands. This combined forest map is further intersected with peatland maps for Indonesia and Malaysia, to separate peat-swamp forests, from dryland forests on mineral soils. To separate mangrove forests, Nusantara Atlas uses a detailed mangrove map for Indonesian New Guinea, while for Indonesia and Malaysia, it intersects the base forest map with a global mangrove map. The final base forest map, which consists of three classes: mangrove, peat-swamp forests, or forests on mineral soils, is updated every year using an annual tree loss dataset.
The deforestation alerts provide information about the area of forest cleared, measured in hectares, as the default reporting metric. Users can access further information by clicking on “details” below this number. These details specify whether the detected alerts pertain to mangroves, peat-swamp forests, or forests on mineral soils. Additionally, they indicate if tree loss was identified outside forested regions, such as in oil palm or acacia plantations. Such occurrences would suggest the clearing of unproductive old oil palm trees or the harvesting of pulp-and-paper plantations.
What are the strengths and limitations of each system?
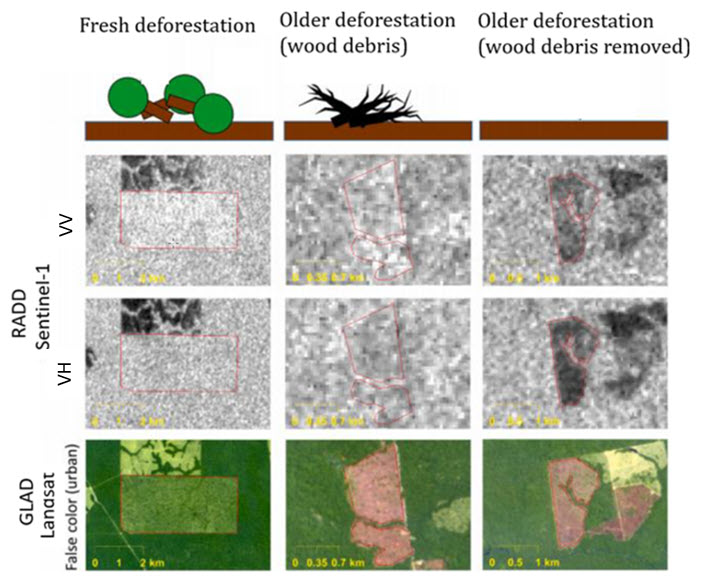
GLAD alerts can detect multiple stages of deforestation, ranging from freshly cleared areas covered with toppled trees to older clearings covered with decomposing wood debris, and ultimately to completely cleared areas with no remaining wood debris. However, their accuracy is limited by cloud cover. This is because clouds obscure the satellite view, which can cause GLAD to not detect deforestation for several months after it has occurred, leading to an omission error. Additionally, GLAD may erroneously identify thin clouds (haze) and sensor errors (e.g. Landsat 7 striping) as deforestation (commission error). In contrast, RADD alerts ‘see’ through clouds, but they may miss detecting deforestation (omission error) due to factors such as wet soil and large wood debris left on the land after deforestation. For example, RADD often misses deforestation on peat-swamps undetected because the soil is very wet. Additionally, RADD may incorrectly identify steep terrain as deforestation (commission error).
To mitigate the issue of commission errors, the creators of GLAD and RADD implemented a process in which detected deforestation alerts are marked as Low confidence until subsequent observations over time increase the confidence that a change is true. For example, in the case of GLAD, deforestation alerts are marked as Low confidence until at least two out of four consecutive temporal observations detect deforestation, at which point alerts are marked as High confidence. Alerts that are only detected once (Low confidence) for four consecutive observations or more than 180 days are eventually eliminated from the datasets. This process helps ensure that clouds and steep slopes mistakenly detected as deforestation are removed.
What is the reason behind integrating both systems into a single measurement?
As we explain above, GLAD and RADD are complementary sensors, each with its own strengths and limitations. As a result, it is common for one sensor to detect deforestation that the other sensor does not. Optical-based GLAD is obscured by clouds, while radar-based RADD sees through clouds. On a clear day, optical-based GLAD detects more stages of deforestation than RADD, because RADD alerts can be obscured by toppled trees and decomposing wood debris, or high-water content in the soil moisture, such as swamps and peat-swamps. By integrating both systems into one single measurement, the deforestation that might be missed by one system or the other can be detected through the strengths of both systems, which will reduce omission errors.
How do we integrate both systems into one single measurement?
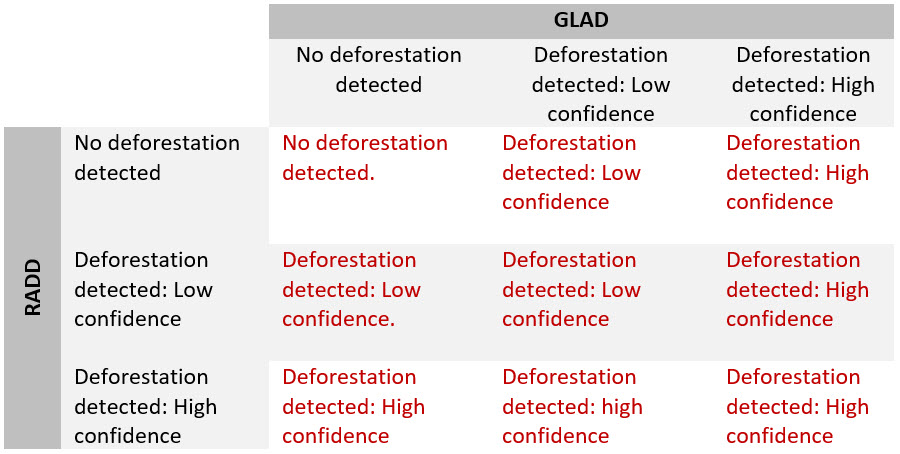
To harmonize spatial resolutions, we resampled GLAD alerts to the same 10-meter spatial scale as RADD. Keep in mind that GLAD and RADD alerts can fall into three categories: 1: No deforestation detected, 2: deforestation detected: low confidence, 3: Deforestation detected: high confidence. This results in nine possible combinations. We recoded these combinations into one of the three initial categories, which means that even if both systems detect deforestation in the same location, we assumed that the level of confidence would not change. This represents a simple, yet effective way of integrating both systems into one single measurement. Finally, when GLAD and RADD both detect the same instance of deforestation at different times, the date of the earliest detection is recorded and retained.
By default, Nusantara Atlas presents a single measure that combines both low and high confidence alerts. It does this because it is more beneficial to use both “Low confidence” and “High confidence” alerts, even though the lack of confirmation process may increase the likelihood of commission errors. This is because cloud cover in equatorial regions causes considerable delays of several months between the initial detection of an alert (low confidence) and its second detection (high confidence). Holding out for high confidence alerts often results in missing the opportunity to take timely and effective action. However, users have the option to only view high confidence alerts by unchecking the corresponding box. This provides users with greater flexibility in customizing their alerts based on their specific needs and preferences.
Why should you always verify alerts using high-resolution satellite imagery?
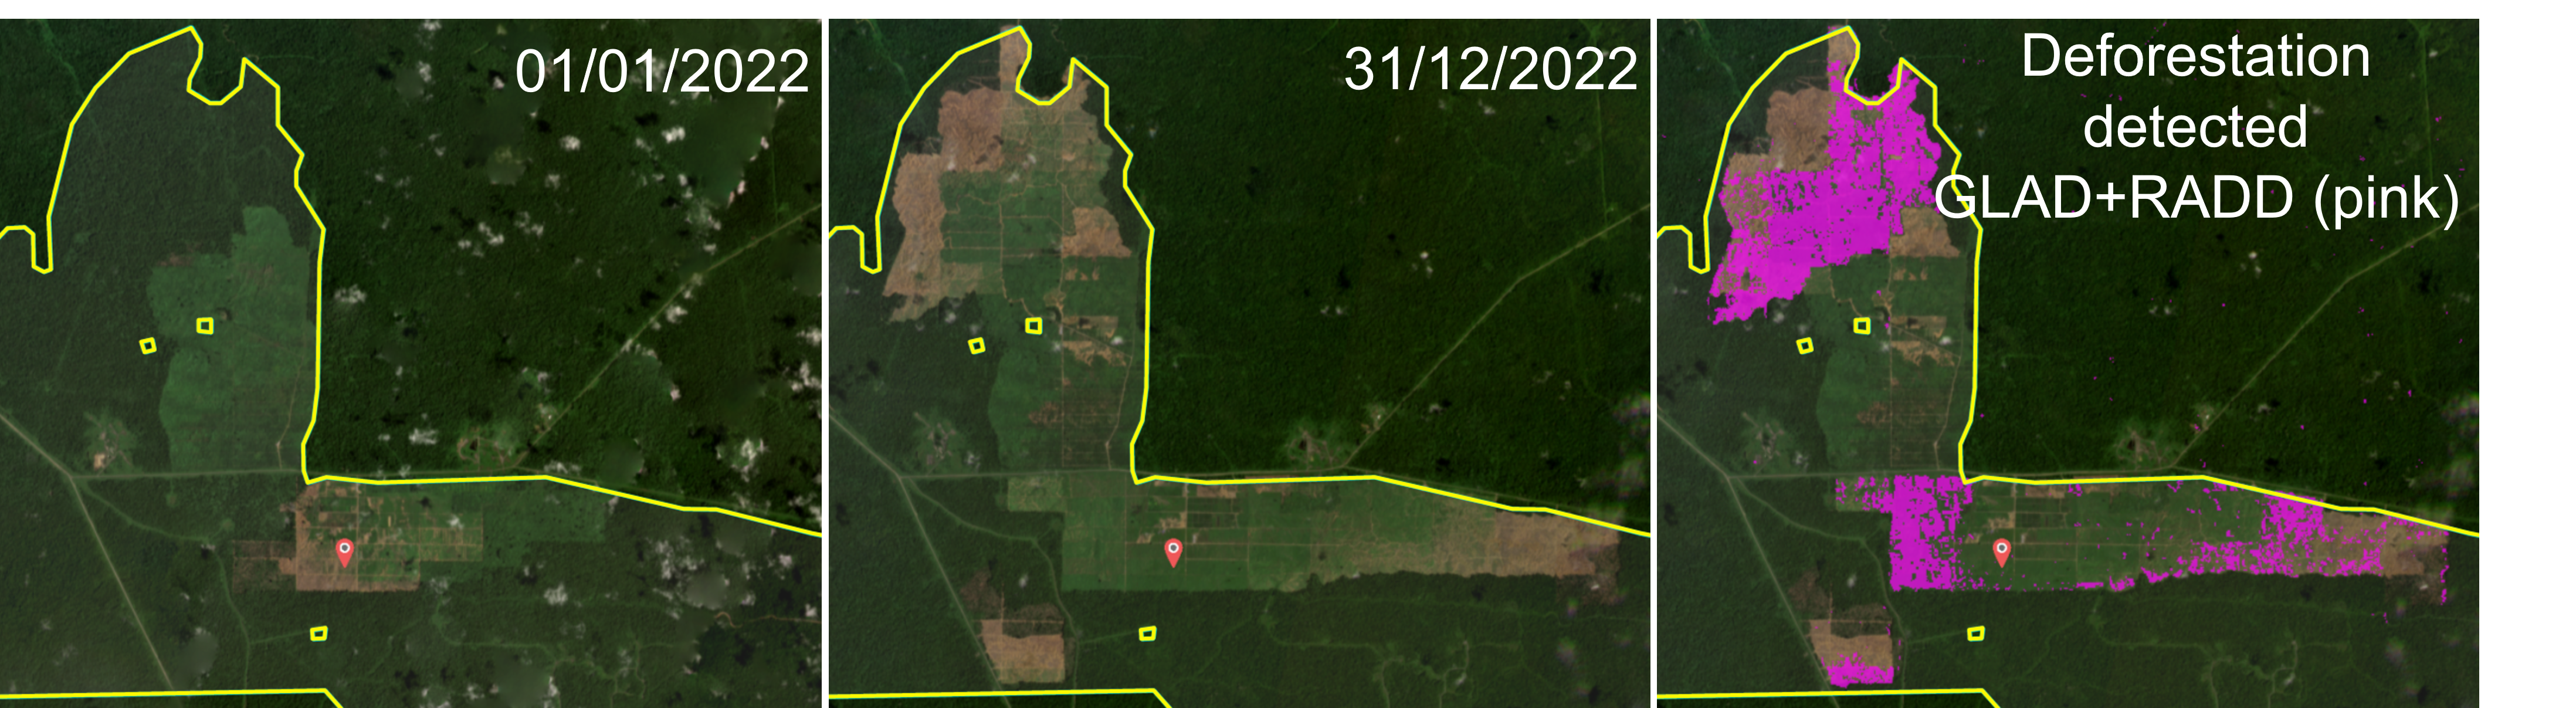
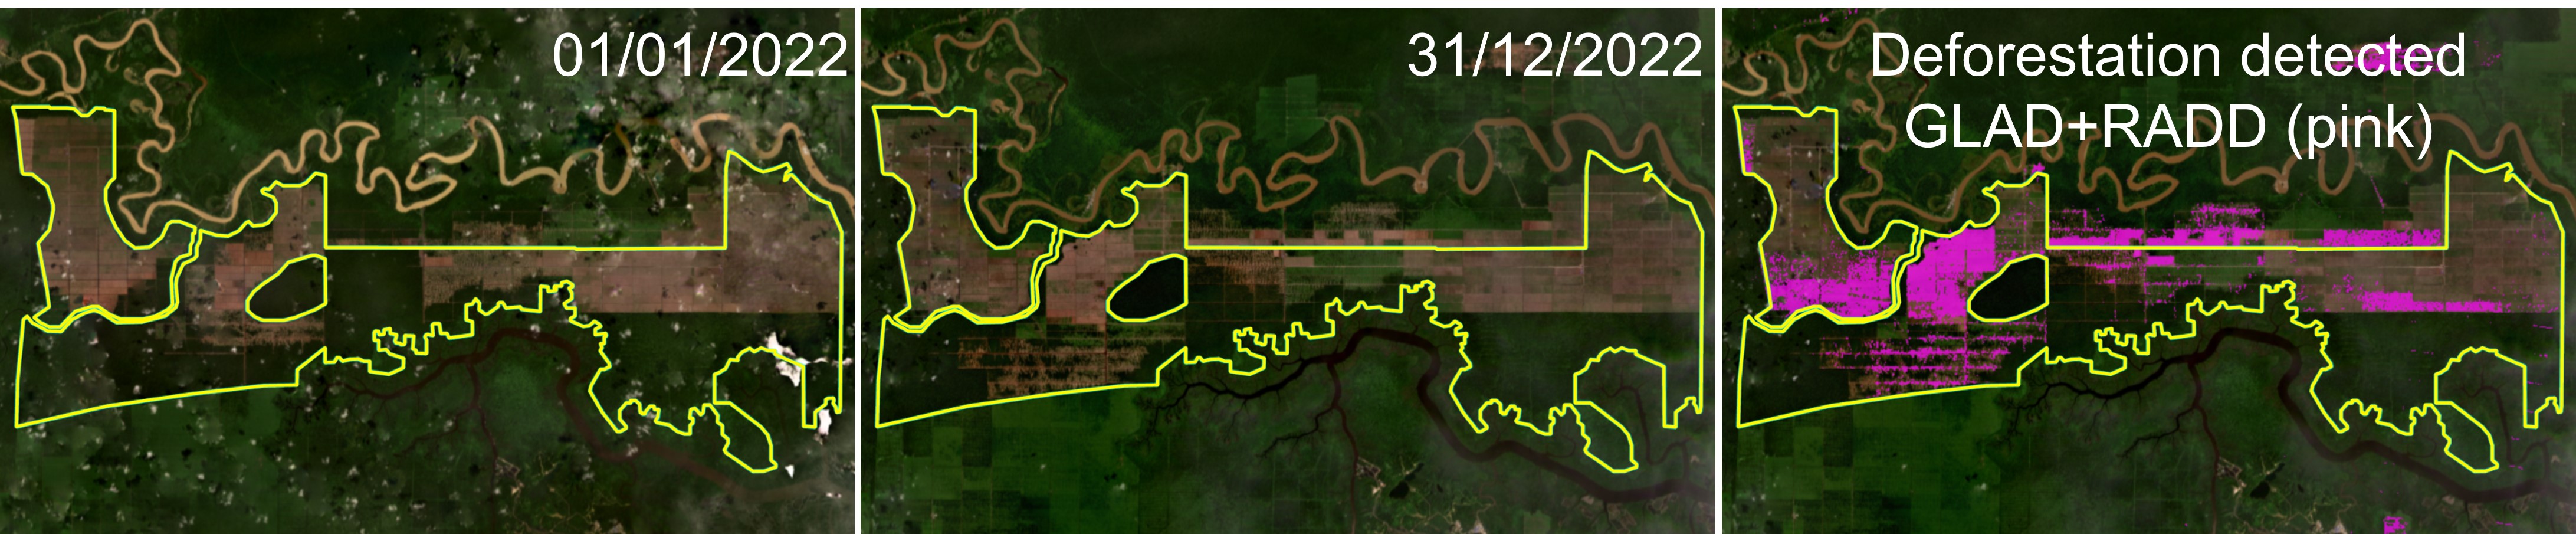
Although combining GLAD and RADD alerts enhances the accuracy of deforestation detection, it is not a flawless solution, and other factors may still influence detection. As a result, we strongly advise utilizing high-resolution satellite imagery accessible through Nusantara Atlas to confirm the validity of the deforestation alerts. Monthly, Planet/NICFI at a 5-meter spatial scale or weekly Sentinel-2 at 10-meters are ideal for this purpose. Verification of alerts can be achieved through a comparison of pre-and post-deforestation imagery or by producing a time-lapse animation that shows the progression of forest contraction caused by fires, deforestation, or agricultural expansion over days, weeks, or even years. By playing these images in sequence, we can observe the areas where deforestation has taken place.
What type of forest loss can be detected?
Integrated alerts in Nusantara Atlas detect permanent forest conversion to agriculture (such as oil palm, acacia, coffee, rubber, cacao, and paddy fields), to built-up areas (such as urban expansion, roads, and industrial parks), to mining sites (including those for gold, coal, nickel, and bauxite) and their associated mine tailings. They also detect forest loss caused by natural wood extraction, such as selective logging, which includes features like logging roads, log landings, and small clearings where trees have been felled. They can also detect forest loss caused by surface water movement, such as river overflows and forest fires. Whether the forest loss caused by these factors is temporary or permanent depends on various factors. For instance, forest loss caused by surface water movement, such as floods is usually temporary, but the extent of the damage inflicted, and the course of the river can affect forest regrowth. Similarly, forest fires can cause lasting damage if they are recurrent, while selective logging usually causes temporary forest loss that regenerates quickly. In cases where forest loss is temporary, the term ‘forest degradation’ may be more appropriate.
Do deforestation alerts determine the specific causes of forest loss?
The GLAD and RADD systems are not able to determine the specific causes of forest loss, such as whether it was caused by deforestation for agriculture, mining, logging, or other reasons described above. Rather, these systems can only detect changes in forest cover over time, which may indicate deforestation or forest degradation. The determination of the specific cause of forest loss requires additional information, such as an analysis of visual patterns, ground-based observations, or other remote sensing data. Therefore, it is important to use caution when interpreting the forest loss data provided by these systems, and to complement them with other sources of information to fully understand the drivers of forest loss.
Can alerts give an indication of whether deforestation is less or worse than last year?
The area of deforestation detected by the alerts over an entire year (from 01 January to 31 December) may result in an underestimation or an overestimation of actual forest area loss in that year. This is because there could be a delay in the detection of deforestation. Alerts may not detect deforestation for several months after it has occurred. Clouds obscure the satellite optical imagery of Landsat, which can cause GLAD alerts to not detect deforestation for several months after it has occurred. Wet soil and large wood debris that remain on the land after deforestation can obscure the satellite radar imagery of Sentinel-1, causing RADD alerts to not detect deforestation for several months after it has occurred.
Suppose deforestation took place in 2022, but it is not detected until the following year (2023). In that case, the area of deforestation calculated for 2022 will be underestimated. Conversely, if the deforestation that occurred in the previous year (2021) is detected in 2022, the calculated area of deforestation for 2022 will be overestimated. Both situations may occur simultaneously over a given area, such that the accuracy of the area calculations will be further affected.
As a result, we advise being cautious when reporting the area of forest loss from the alerts. The detection of more deforestation alerts in one year compared to the previous year may not necessarily indicate an actual increase in deforestation, but rather inherent limitations of detection. Despite this caution, it may still be possible that such a comparison may indicate a meaningful change in the extent of deforestation. To obtain an accurate measurement of deforestation in a given area, we recommend using higher-resolution satellite optical imagery such as Planet/NICFI at a 5-meter spatial scale or Sentinel-2 at 10-meter.