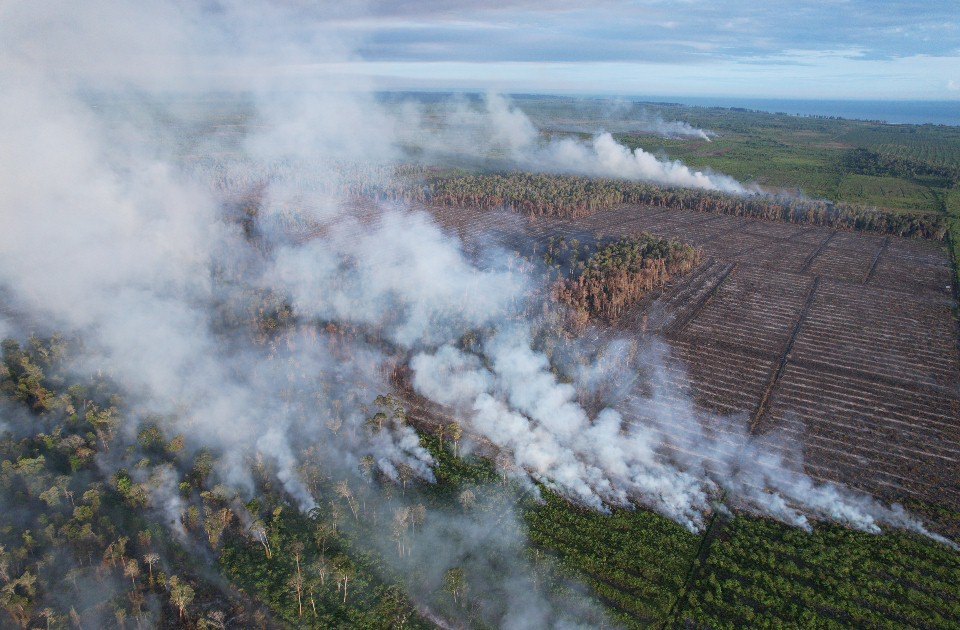
 Fire burning across peatland within an oil palm concession in Aceh in June 2026. Photo: Apel Green Aceh.
 Monthly Burn Scars and Fire Season Progress Now Live on Nusantara Atlas
Fire burning across peatland within an oil palm concession in Aceh in June 2026. Photo: Apel Green Aceh. Indonesia is entering the dry season with early warning signs that fires are picking up. FireWatch, Nusantara Atlas’ new Fire Season Progress dashboard, provides a national overview of the current fire situation and rankings of the most affected provinces.
The dashboard brings together two complementary fire indicators. Fire hotspots provide a daily signal of active fires as point locations. Burn scars show the impact left behind: where vegetation has burned into deposits of char and ash, and how much land was affected. Together, they show how the current fire season is unfolding and how it compares with 2019–2025.
An early start to the 2026 fire season
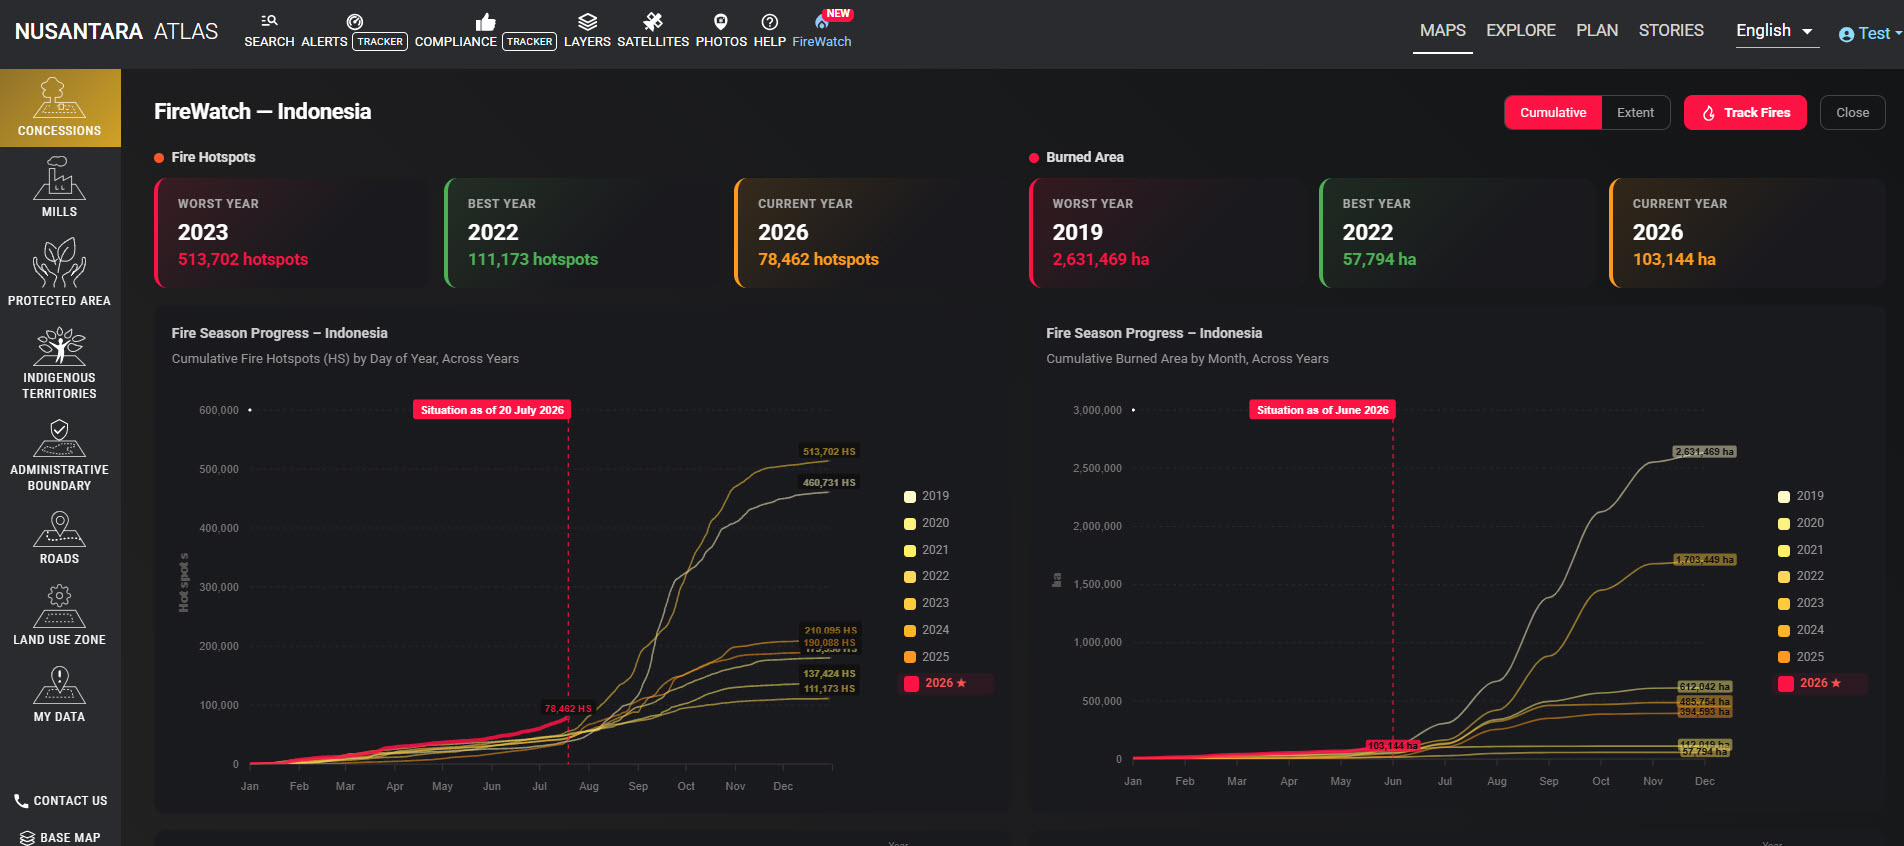
As of 20 July 2026, cumulative hotspot activity in 2026 was above every previous year at the same point in the season, including the major fire years of 2019 and 2023.
During the first half of 2026, approximately 103,000 hectares burned across Indonesia. East Nusa Tenggara recorded the largest burned area, at 25,466 hectares, followed by West Kalimantan with 20,432 hectares and Riau with 11,525 hectares.
These figures remain far below the 2.63 million hectares burned in 2019. However, Indonesia has not yet entered the period when fire activity has historically accelerated most sharply. Burning usually accelerates in August and peaks during September and October. The current hotspots signal is therefore an early warning, not yet the peak.
Independent monthly monitoring of burned area
With this release, Nusantara Atlas provides Indonesia’s first independent, operational monthly burned area monitoring system built on a peer-reviewed scientific methodology. The monthly burn-scar maps are generated at 20 m resolution using our Sentinel-2 methodology published in PLOS ONE and processed in Google Earth Engine. The method was designed to provide conservative, high-confidence burned-area detections across Indonesia.
These new monthly burned area data form the foundation of FireWatch, alongside our daily fire-hotspot data by NASA.
From national trends to individual land units
Both indicators can now be accessed via Track Fires in FireWatch, or directly by clicking Alert Tracker.
While FireWatch provides a national overview of the current fire situation across Indonesia, the Alerts Tracker enables users to investigate fire activity and impacts within individual land units, including concessions, protected areas, and jurisdictions, and identify the areas requiring the most urgent attention.
Users can investigate fire activity using timeframes adapted to each indicator. For daily fire hotspots, predefined periods include Today, Last 2 Days, Last 7 Days, and Last 14 Days, allowing users to follow active fires in near real time. For monthly burn scars, users can assess burned-area impacts using Last Month — the latest completed monthly burn-scar update — Last 3 Months, Last 6 Months, and Last 12 Months, or any custom period within the past 360 days.
Together with the existing Weekly Deforestation Tracker, the tool generates dynamic lists of the land units most affected by fire or deforestation over the selected period. A set of predefined lists covering key land-unit categories is available under the Default tab. From these lists, users can click View to zoom to a selected land unit in the map panel on the right, where the corresponding alerts are displayed and can be verified against satellite imagery. This functionality is invaluable for prioritising action by identifying where burning or forest clearance is occurring and tracking which companies, jurisdictions, and protected areas are associated with these events.
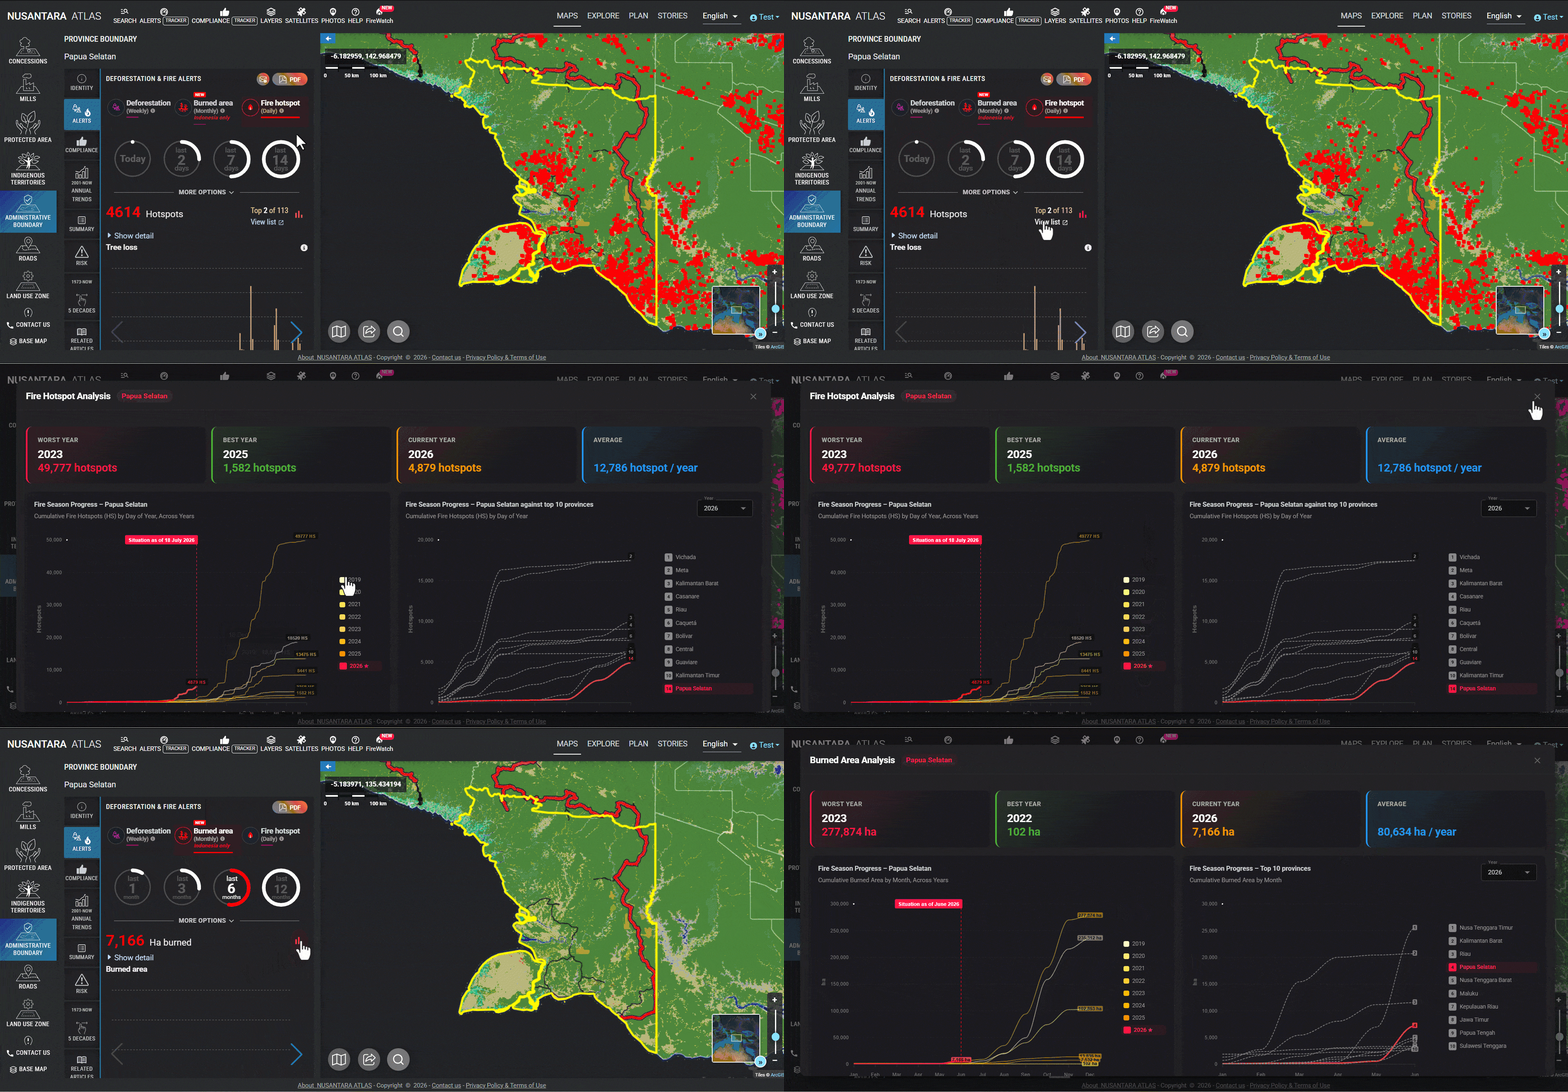
For each selected land unit, users can open two separate dashboards: one for burned area and one for hotspots. They summarise historical and current fire exposure, including the land unit’s worst year, least-affected year, and current situation and as well as average. Each dashboard contains four analytical panels, allowing the two fire indicators to be examined independently and in greater detail. In total, users can explore eight graphs for each concession, protected area, or jurisdiction. Two of these mirror the Fire Season Progress analyses presented in FireWatch, but are recalculated specifically for the selected land unit. Together, these individual dashboards allow users to move from national fire-season trends to detailed fire histories for individual land units.
South Papua shows why early monitoring matters
Turning to South Papua, the province ranked fourth nationally for both hotspot activity and burned area during the first half of 2026. The dashboards indicate that the fire season in this province is starting earlier than usual, raising particular concern in areas where Indonesia’s South Papua National Strategic Project (PSN) is being developed and where we anticipate heightened fire risk.
Looking at annual trends
Derived from the Monthly Burn Scar Tracker, Nusantara Atlas also includes an Annual Burned Area Tracker within its compliance tool. The tracker aggregates monthly burn scars into annual burned-area totals from 2019 to 2025. This allows users to assess fire history against different compliance cut-off dates, including EUDR, RSPO, and NDPE requirements, and to compare whether burning occurred before or after a selected date within concessions, protected areas, and jurisdictions.
The Annual Burned Area Tracker helps identify important biodiversity areas where fire is becoming an increasing threat. In protected areas where fire has historically been rare, such as Rawa Singkil Wildlife Reserve, annual burn-scar data reveal a clear increase in peatland burning since 2022.
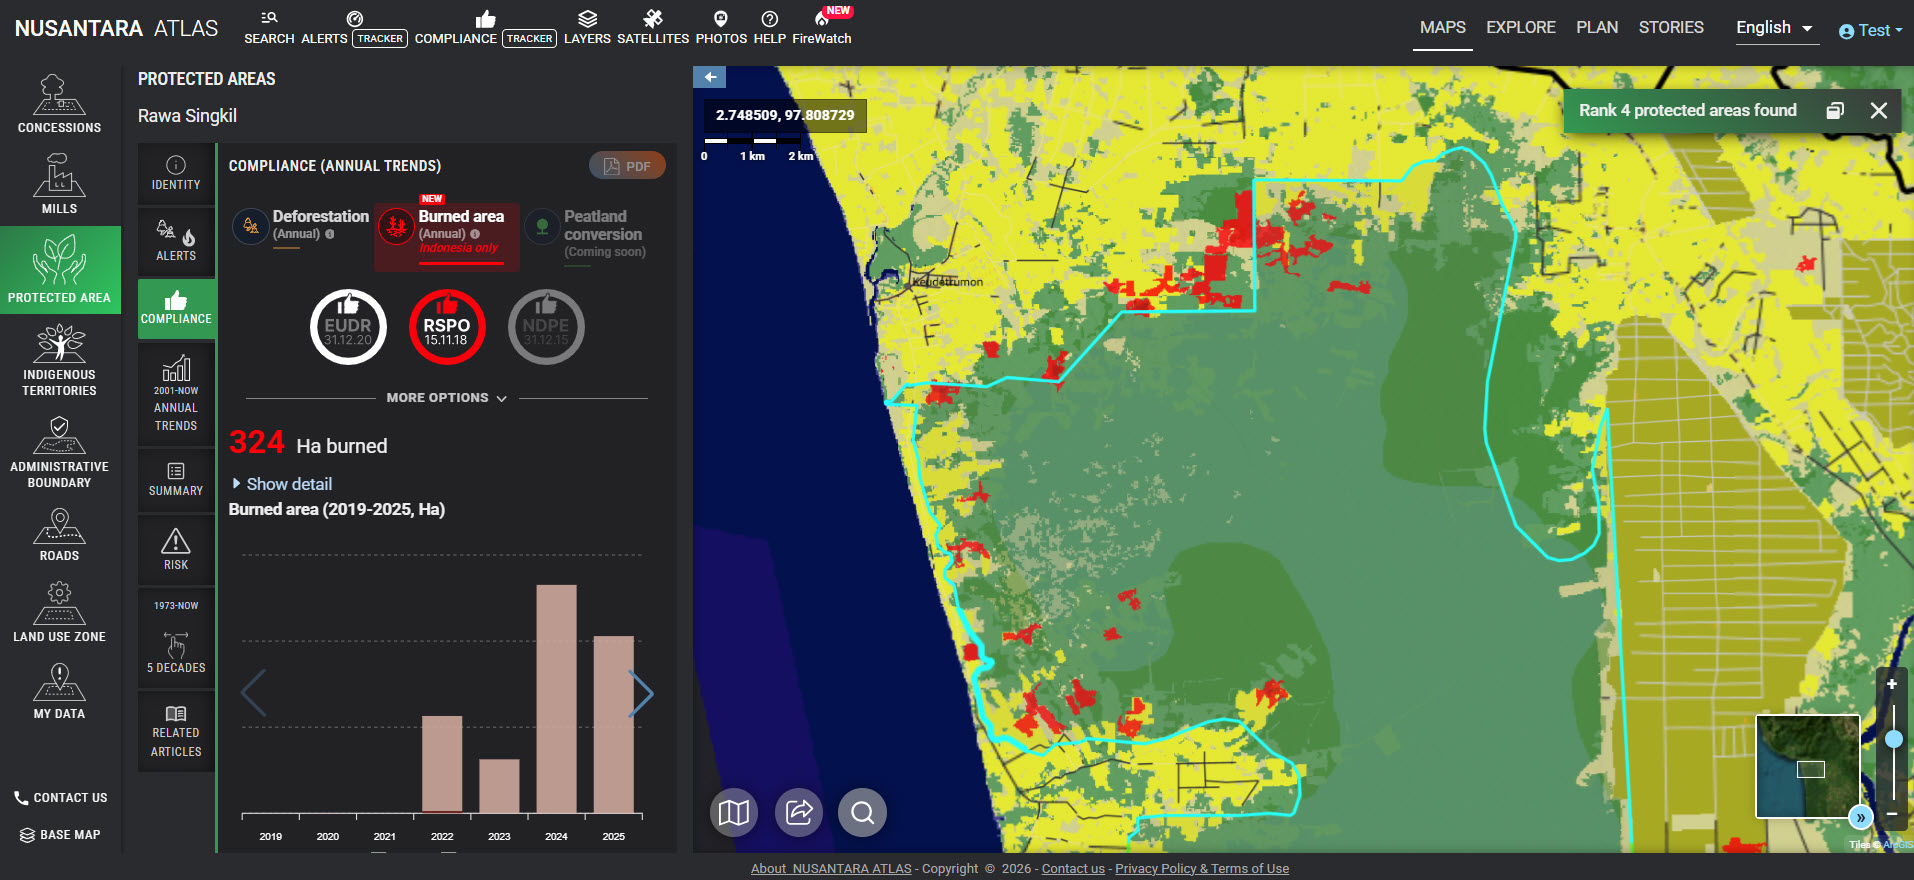
wing increasing burns in recent years inside the reserve.
In landscapes such as Sumba, the annual data highlights a different fire dynamic, where savanna grasslands burn repeatedly from year to year.
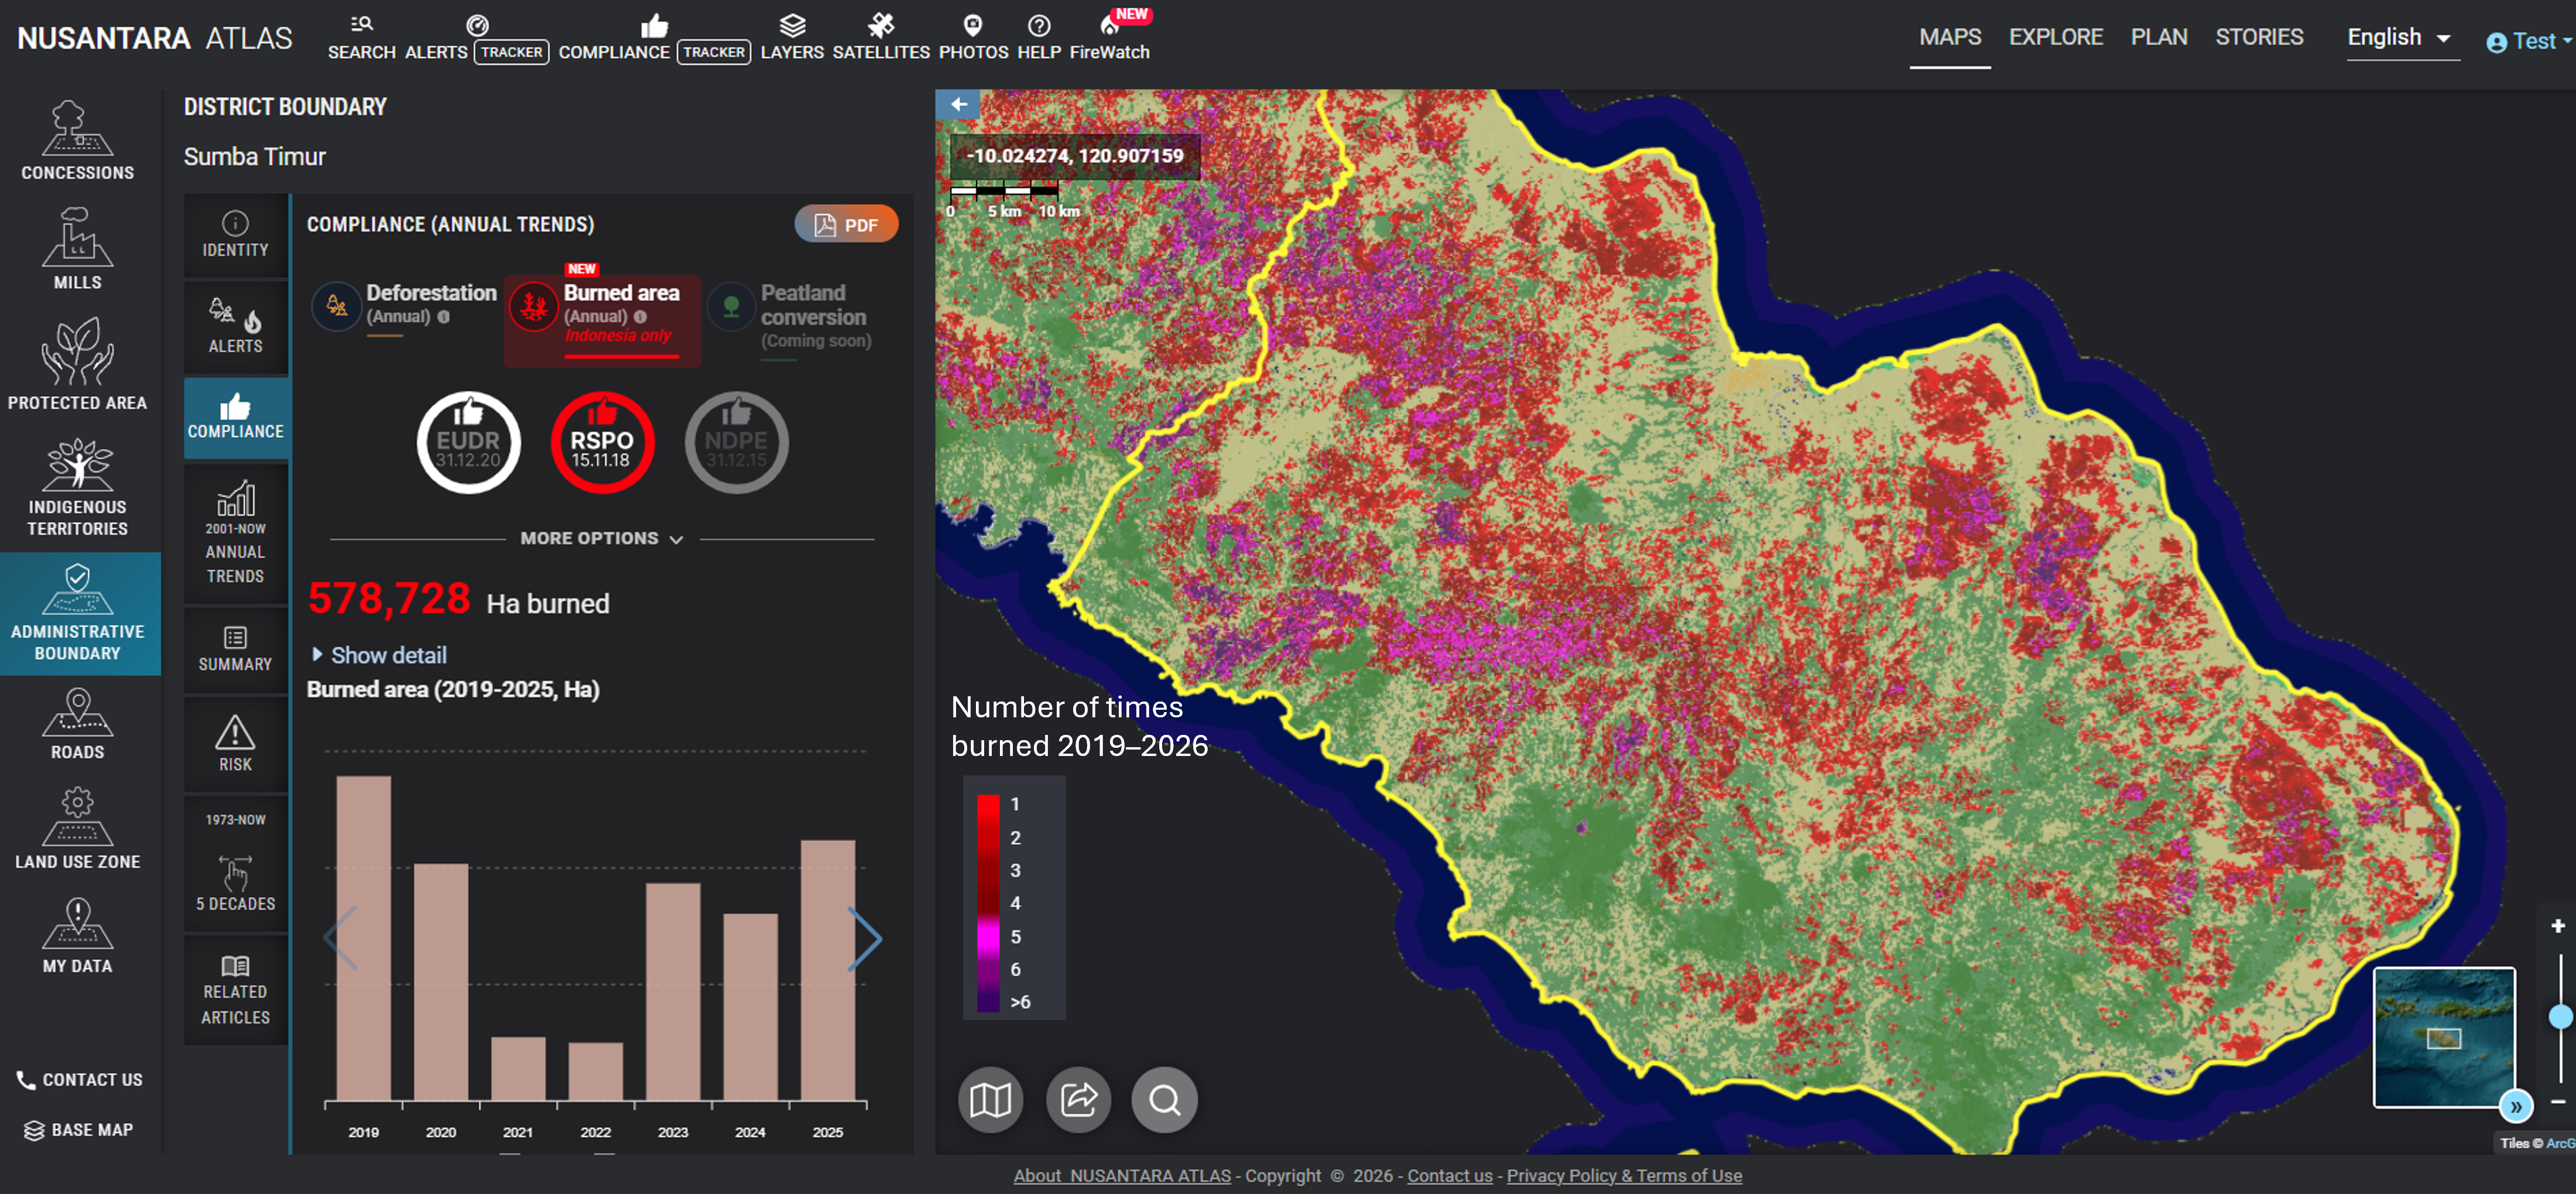
To make these patterns visible, Nusantara Atlas maps both the annual burned area and the frequency of burning. Areas that burned once appear in lighter red, while areas that burned repeatedly are shown in darker red to purple tones. This distinction is important because a landscape that burns every year may have a modest annual burned extent, but a much higher cumulative burned area over time.
This is why Nusantara Atlas reports two complementary burned area statistics : burned extent and cumulative burned area. Cumulative burned area counts repeated burns, so the same area is counted again if it burned in multiple years or multiple events. Burn extent does not count repeated burns, only once. Together, these statistics distinguish one-off fire events from landscapes affected by chronic, repeated burning.
Follow the fire season as it unfolds
The World Meteorological Organization forecasts that El Niño will intensify through the coming months, with its July outlook indicating rapid development into a strong event during July–September and continued strengthening through the Northern Hemisphere autumn.
With El Niño strengthening and Indonesia’s highest-risk fire months still ahead, the warning signs will need to be watched closely. Nusantara now allows anyone to monitor the fire season as it unfolds using independent daily hotspot and monthly burned-area data —from national trends down to individual concessions, protected areas, and jurisdictions.